Linux I/O Monitoring and Analyze: Difference between revisions
From WikiMLT
| Line 3: | Line 3: | ||
== Htop 3.2+ == | == Htop 3.2+ == | ||
If the latest version of <code>htop</code> is available at your distribution, there is available an additional tab that shows the <code>I/O</code> metrics of the instance. Here is how to check the available version and install <code>htop</code>. | If the latest version of <code>htop</code> is available at your distribution, there is available an additional tab that shows the <code>I/O</code> metrics of the instance - {{Media-cite|sf|1}}. Here is how to check the available version and install <code>htop</code>. | ||
<syntaxhighlight lang="shell" line="1" class="mlw-continue mlw-shell-gray margin-top-gray"> | <syntaxhighlight lang="shell" line="1" class="mlw-continue mlw-shell-gray margin-top-gray"> | ||
sudo apt show htop 2>/dev/null | grep '^Version' | sudo apt show htop 2>/dev/null | grep '^Version' | ||
Revision as of 14:54, 28 August 2022
There is a couple of tools available that allows you to monitor and analyze the disk I/O performance of your Linux driven system. Here are listed few of them and also how to install and examples of their basic usage.
Htop 3.2+
If the latest version of htop is available at your distribution, there is available an additional tab that shows the I/O metrics of the instance – Screen 1. Here is how to check the available version and install htop.
sudo apt show htop 2>/dev/null | grep '^Version'
sudo apt install htop
Screen 1. The new I/O Metrics tab of 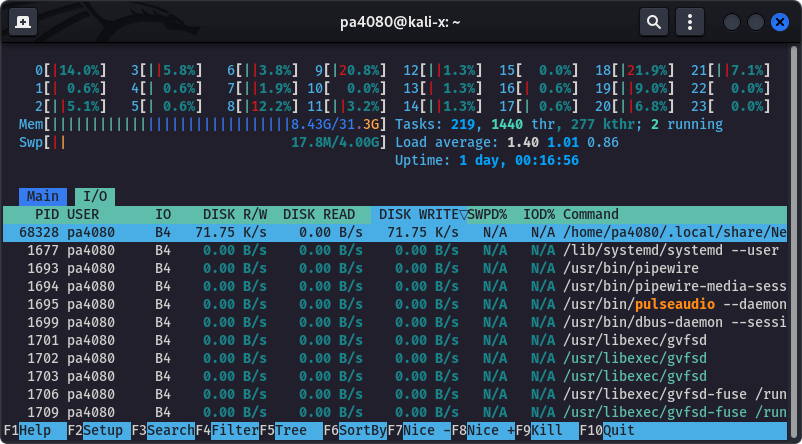
htop (v 3.2+). Use Tab to switch to the I/O tab, then use F6 to open the Sort by menu, and sort by IO_WRITE_RATE. The screenshot is taken on Kali Linux 2022. 
Section 1
…