Linux I/O Monitoring and Analyze: Difference between revisions
From WikiMLT
Tag: Reverted |
|||
| Line 7: | Line 7: | ||
{{sform|1|Htop-io-metrics-tab.png|1|{{pt|s=1|i=1|c=red|a=0|x=94|y=290|z=1}}{{pt|s=1|i=2|c=red|a=0|x=367|y=55|z=1}}{{pt|s=1|i=3|c=red|a=0|x=359|y=272|z=1}} | {{sform|1|Htop-io-metrics-tab.png|1|{{pt|s=1|i=1|c=red|a=0|x=94|y=290|z=1}}{{pt|s=1|i=2|c=red|a=0|x=367|y=55|z=1}}{{pt|s=1|i=3|c=red|a=0|x=359|y=272|z=1}} | ||
| t = 16 | | t = 16 | ||
}} | |||
{{sform|1|Шаблони демо Структура на Технологичната среда.png|1|{{pt|s=1|i=1|c=green|a=-90|x=93|y=329}} | |||
{{pt|s=1|i=2|c=green|a=-90|x=371|y=172}} | |||
{{pt|s=1|i=1|c=green|a=90|x=853|y=408}} | |||
{{pt|s=1|i=А|c=blue|a=0|x=380|y=546}} | |||
{{pts|s=1|i=Б|c=blue|x=385|y=280|w=615|h=215|hy=50|wx=100.1}} | |||
{{pt|s=1|i=В|c=blue|a=270|x=371|y=247.1875|z=1}} | |||
{{pt|s=1|i=I|c=red|a=0|x=485|y=300}} | |||
{{pt|s=1|i=II|c=red|a=0|x=578|y=300}} | |||
| t = 16 | |||
| b = | |||
| side = 44 | |||
}} | }} | ||
Revision as of 12:46, 28 August 2022
There is a couple of tools available that allows you to monitor and analyze the disk I/O performance of your Linux driven system. Here are listed few of them and also how to install and examples of their basic usage.
Htop 3.2+
If the latest version of htop is available at your distribution, there is available an additional tab that shows the I/O metrics of the instance. Here is how to check the available version and install htop.
Screen 1. The new I/O Metrics tab of 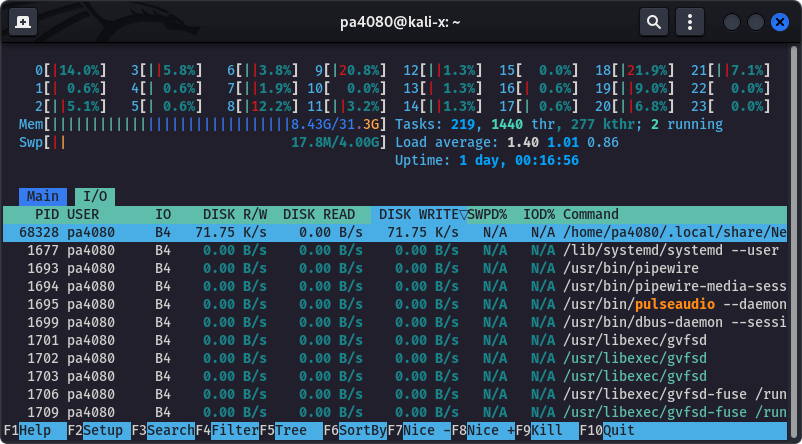
htop (v 3.2+). Use Tab to switch to the I/O tab, then use F6 to open the Sort by menu, and sort by IO_WRITE_RATE. The screenshot is taken on Kali Linux 2022. 

Section 1
…