Linux I/O Monitoring and Analyze: Difference between revisions
| Line 97: | Line 97: | ||
| t = 16 | | t = 16 | ||
| side = 16 | | side = 16 | ||
}} | }}Here is an advanced version :) which outputs also an additional data generated by <code>iostat</code>:<syntaxhighlight lang="shell" line="1" class="multi-line-cmd"> | ||
sudo watch -d \ | |||
"find /var/lib /var/log -type f -size +800k -mmin -10 -printf '%s \t %t %p\n' | grep -Pv '\.(gz|[0-9])$'; | |||
echo; | |||
iostat /dev/sda2" | |||
</syntaxhighlight><syntaxhighlight lang="shell-session"> | |||
ss | |||
</syntaxhighlight> | |||
== References == | == References == | ||
Revision as of 21:43, 28 August 2022
There is a couple of tools available that allows you to monitor and analyze the disk I/O performance of your Linux driven system. Here are listed few of them and also how to install and examples of their basic usage.
The htop command
If a newer version of htop is available at your distribution, there is available an additional tab that shows the I/O metrics of the instance – Screen 1. Here is how to check the available version and install htop.
sudo apt show htop 2>/dev/null | grep '^Version'
sudo apt install htop
Install the latest version of htop 3.2.1–1 on Ubuntu Server 22.04.1 from a .deb package.
cd /tmp
wget --no-check-certificate https://http.us.debian.org/debian/pool/main/h/htop/htop_3.2.1-1_amd64.deb
sudo apt install ./htop_3.2.1-1_amd64.deb
To be able to see all data in most cases you need to run the tool as root:
sudo htop
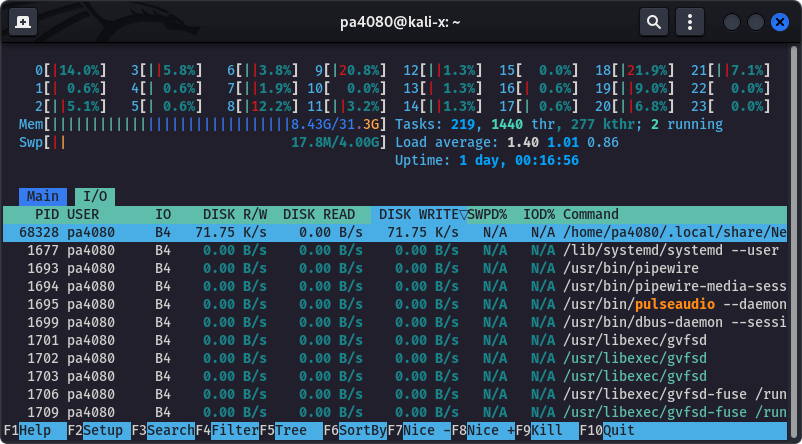
htop (v 3.2+). Use Tab to switch to the I/O tab, then use F6 to open the Sort by menu, and sort by IO_WRITE_RATE. The screenshot is taken on Kali Linux 2022. 
The iostat command
…
The iotop command
…
The dstat command
sudo apt install dstat
sudo dstat -D sdc -ta --top-bio
----system---------total-cpu-usage-------dsk/sdc------net/total------paging-------system--------most-expensive--------
     time      | usr sys idl wai stl | read   writ | recv   send |  in   out  | int   csw  |  block     i/o   process
¯¯¯¯¯¯¯¯¯¯¯¯¯¯¯¯¯¯¯¯¯¯¯¯¯¯¯¯¯¯¯¯¯¯¯¯¯¯¯¯¯¯¯¯¯¯¯¯¯¯¯¯¯¯¯¯¯¯¯¯¯¯¯¯¯¯¯¯¯¯¯¯¯¯¯¯¯¯¯¯¯¯¯¯¯¯¯¯¯¯¯¯¯¯¯¯¯¯¯¯¯¯¯¯¯¯¯¯¯¯¯¯¯¯¯¯¯¯
02-04 09:25:42 |  2   0  97   0   0  | 160k   208k |   0      0  | 170B  835B | 1951  7955 | systemd    1285k 1569k
02-04 09:25:43 |  2   1  97   0   0  |   0      0  |  66k    57k |   0     0  | 2614  5033 | pvestatd   1280k    0
02-04 09:25:44 |  2   1  98   0   0  |   0      0  |  16k    21k |   0     0  | 2830  7131 | kvm           0    32k
02-04 09:25:45 |  2   1  98   0   0  |   0      0  |  45k    54k |   0     0  | 2347  5187 | kvm           0   320k
02-04 09:25:46 |  3   1  96   0   0  |   0      0  |  24k    29k |   0     0  | 2686  8578 | ceph-mon      0    64k
The sar command
The sar command is par of the package sysstat. It outputs the contents of selected cumulative activity counters in the operating system. The activities are collected by the sysstat.service. After installing the package we need to enable the collector service and wait until some statistics are collected.
sudo apt install sysstat
sudo sed -i 's/ENABLED="false"/ENABLED="true"/' /etc/default/sysstat
sudo systemctl enable --now sysstat.service
systemctl cat sysstat-collect.timer
# /lib/systemd/system/sysstat-collect.timer
# /lib/systemd/system/sysstat-collect.timer
# (C) 2014 Tomasz Torcz <tomek@pipebreaker.pl>
#
# sysstat-12.5.2 systemd unit file:
#        Activates activity collector every 10 minutes

[Unit]
Description=Run system activity accounting tool every 10 minutes

[Timer]
OnCalendar=*:00/10

[Install]
WantedBy=sysstat.service
sar
Linux 5.15.39-4-pve (ubuntu-lxc-pve) 	08/28/22 	_x86_64_	(24 CPU)

20:41:48     LINUX RESTART	(24 CPU)

20:50:05        CPU     %user     %nice   %system   %iowait    %steal     %idle
21:00:00        all      1.66      0.00      0.26      0.02      0.00     98.06
21:10:10        all      2.66      0.00      0.27      0.03      0.00     97.03
21:20:13        all      1.92      0.00      0.29      0.02      0.00     97.76
Average:        all      2.09      0.00      0.27      0.03      0.00     97.62
Monitor the Files Size Changes Recursively
By the following command we can monitor which are the most written files for the past 10 minutes, larger than 800 Kb. This is done recursively for the directories /var/lib and /var/log. The output of the command is shown at Screen 2.
sudo watch -n 3 -d \
"find /var/lib /var/log -type f -size +800k -mmin -10 -printf '%s    \t %t %p\n' | grep -Pv '\.(gz|[0-9])$'"
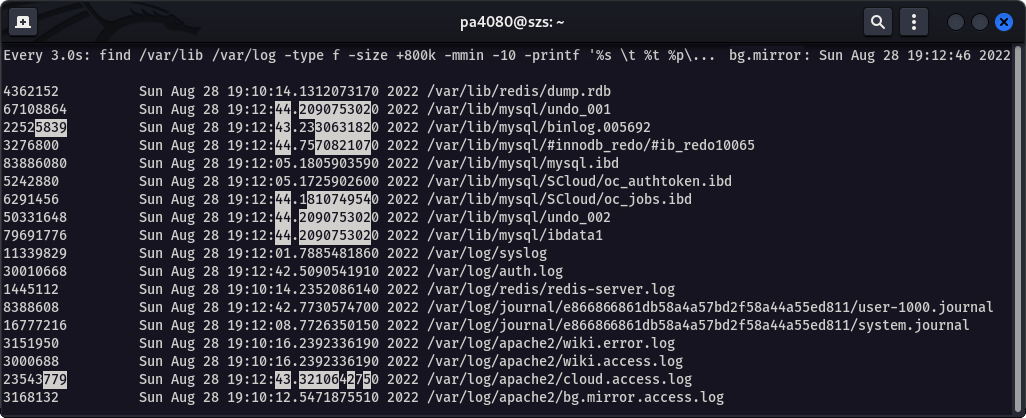
watch and find to monitor file change in real time. 
Here is an advanced version :) which outputs also an additional data generated by iostat:
sudo watch -d \
"find /var/lib /var/log -type f -size +800k -mmin -10 -printf '%s    \t %t %p\n' | grep -Pv '\.(gz|[0-9])$';
 echo;
 iostat /dev/sda2"
ss
References
- Htop: GitHub | Home page [
htop] - Unix and Linux: How can I monitor disk I/O? [
sar,iostat,iotop] - Unix and Linux: How do I measure total disk I/O per hour? [
dstat,iostat] - Proxmox Forum: Disk prevent from spinning down because of pvestatd [
dstat] - PVE HDD Sleep (Suspend)
- Preload Tool for Better System Performance
- Linux Swap and Swapfile