Linux I/O Monitoring and Analyze
There is a couple of tools available that allows you to monitor and analyze the disk I/O performance of your Linux driven system. Here are listed few of them and also how to install and examples of their basic usage.
The htop command
If a newer version of htop is available at your distribution, there is available an additional tab that shows the I/O metrics of the instance – Screen 1. Here is how to check the available version and install htop.
sudo apt show htop 2>/dev/null | grep '^Version'
sudo apt install htop
Install the latest version of htop 3.2.1–1 on Ubuntu Server 22.04.1 from a .deb package.
cd /tmp
wget --no-check-certificate https://http.us.debian.org/debian/pool/main/h/htop/htop_3.2.1-1_amd64.deb
sudo apt install ./htop_3.2.1-1_amd64.deb
To be able to see all data in most cases you need to run the tool as root:
sudo htop
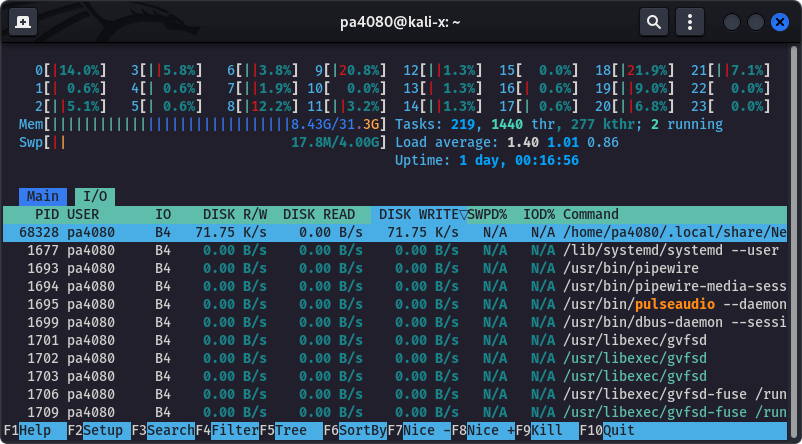
htop (v 3.2+). Use Tab to switch to the I/O tab, then use F6 to open the Sort by menu, and sort by IO_WRITE_RATE. The screenshot is taken on Kali Linux 2022. 
The iostat command
iostat – Report Central Processing Unit (CPU) statistics and input/output statistics for devices and partitions. The iostat command is used for monitoring system input/output device loading by observing the time the devices are active in relation to their average transfer rates…
The first report generated by the iostat command provides statistics concerning the time since the system was booted, unless the -y option is used. Each subsequent report covers the time since the previous report. All statistics are reported each time the iostat command is run. The report consists of a CPU header row followed by a row of CPU statistics. On multiprocessor systems, CPU statistics are calculated system-wide as averages among all processors. A device header row is displayed followed by a line of statistics for each device that is configured…
Here is how to get the general report in human readable format.
iostat -h
Linux 5.18.0-kali5-amd64 (kali-x) 	08/31/2022 	_x86_64_	(24 CPU)

avg-cpu:  %user   %nice %system %iowait  %steal   %idle
           0.4%    0.0%    0.2%    0.1%    0.0%   99.2%

      tps    kB_read/s    kB_wrtn/s    kB_dscd/s    kB_read    kB_wrtn    kB_dscd Device
    11.50       224.2k        20.9k         0.0k       1.2G     119.2M       0.0k dm-0
    10.90       221.8k        20.9k         0.0k       1.2G     119.2M       0.0k dm-1
    10.99       315.7k        56.2k         0.0k       1.8G     320.0M       0.0k nvme0n1
     0.06         1.6k         0.0k         0.0k       8.9M       0.0k       0.0k sda
     4.14        55.1k         0.0k         0.0k     313.8M     152.0k       0.0k sdb
Here is how to get report per device, per 1 minute, with timestamp in human readable format. Note the first report provides statistics concerning the time since the system was booted, the later reports provide statistic per 60 seconds.
iostat -h /dev/nvme0n1 -d -t 60
Linux 5.18.0-kali5-amd64 (kali-x) 	08/31/2022 	_x86_64_	(24 CPU)

08/31/2022 05:39:22 PM
      tps    kB_read/s    kB_wrtn/s    kB_dscd/s    kB_read    kB_wrtn    kB_dscd Device
    10.45       297.5k        53.6k         0.0k       1.8G     324.5M       0.0k nvme0n1

08/31/2022 05:40:22 PM
      tps    kB_read/s    kB_wrtn/s    kB_dscd/s    kB_read    kB_wrtn    kB_dscd Device
     1.10         0.6k        10.2k         0.0k      36.0k     612.0k       0.0k nvme0n1
Here is how to get the same as the above statistic but concerned to a LVM logical volume.
iostat -h /dev/mapper/kali--x--vg-home -d -t 60
Linux 5.18.0-kali5-amd64 (kali-x) 	08/31/2022 	_x86_64_	(24 CPU)

08/31/2022 05:45:11 PM
      tps    kB_read/s    kB_wrtn/s    kB_dscd/s    kB_read    kB_wrtn    kB_dscd Device
     4.02        68.4k        19.7k         0.0k     437.2M     125.9M       0.0k dm-5

08/31/2022 05:46:11 PM
      tps    kB_read/s    kB_wrtn/s    kB_dscd/s    kB_read    kB_wrtn    kB_dscd Device
     0.30         0.0k         1.1k         0.0k       0.0k      68.0k       0.0k dm-5
Watch the changes in the full statistics per half second. In the the following example:
iostat ‑y ‑h– suppress the report since the boot time, human readable format,iostat 1 1–[ interval [ count ] ]– one count per one second.- watch ‑n 0.5 ‑d – refresh per 0.5 seconds, show the difference
watch -n 0.5 -d "iostat -h -y 1 1"
Display extended statistics for the whole system, in human readable format, with timestamp, per 6 seconds.
iostat -x -h -t 6
The iotop command
iotop – simple top-like I/O monitor – watches I/O usage information available in the Linux kernel (requires 2.6.20 or later) and displays a table of current I/O usage by processes or threads on the system. At least the CONFIG_TASK_DELAY_ACCT, CONFIG_TASK_IO_ACCOUNTING, CONFIG_TASKSTATS and CONFIG_VM_EVENT_COUNTERS options need to be enabled in your Linux kernel build configuration…
Starting with Linux kernel 5.14.x task_delayacct is configurable at runtime and set to off by default. This setting can be changed in interactive mode by the Ctrl+T shortcut. In batch mode a warning is printed when the setting is OFF. From the command line this can be enabled by: sudo sysctl kernel.task_delayacct=1, and disabled again by sudo sysctl kernel.task_delayacct=0. It is advisable to keep this option off when not using this or another monitoring program because when enabled it has some effect on system performance.
On Screen 3, at the bottom image is shown the very basic usage of iotop without, and at the top image how the output looks like with the following options (reference):
-a– will show accumulated output,-o– will only output,-P– will only show processes instead of threads.
sudo iotop -aoP
sudo iotop
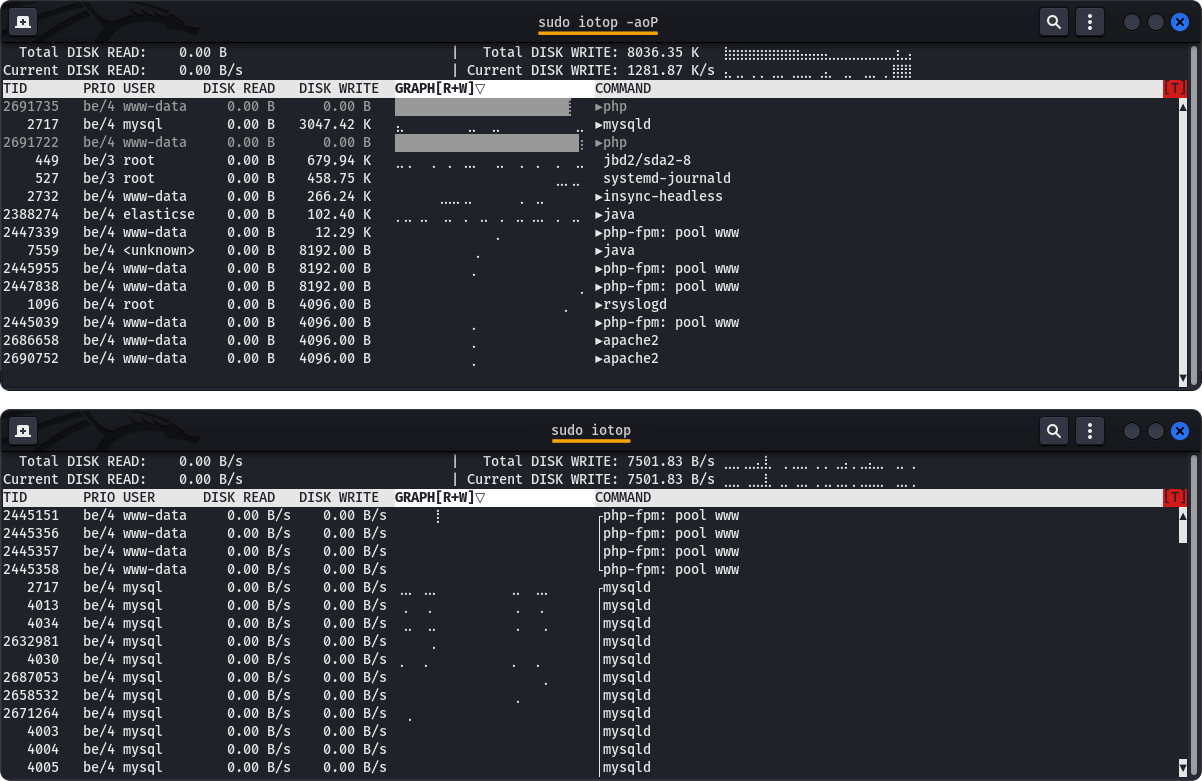
iotop command. 
The dstat command
dstat is a versatile tool for generating system resource statistics, it is a versatile replacement for vmstat, iostat and ifstat. Dstat is unique in letting you aggregate block device throughput for a certain diskset or network bandwidth for a group of interfaces, ie. you can see the throughput for all the block devices that make up a single filesystem or storage system.
sudo apt install dstat
There is an uncountable multitude of options and plugins available for dstat. Here is one example of usage – Screen 3 – where are applied the following options.
-D sdc– adds column that reports the I/O rate of/dev/sdc.-t,--time– enable time/date output.-a,--all– equals to-cdngy(-ccpu,-ddisk;-nenable network stats;-genable page stats;-yenable system stats).--top-io– show most expensive I/O process.--top-bio– show most expensive block I/O process.--top-mem– show process using the most memory.
sudo dstat -D sda -ta --top-io --top-bio --top-mem
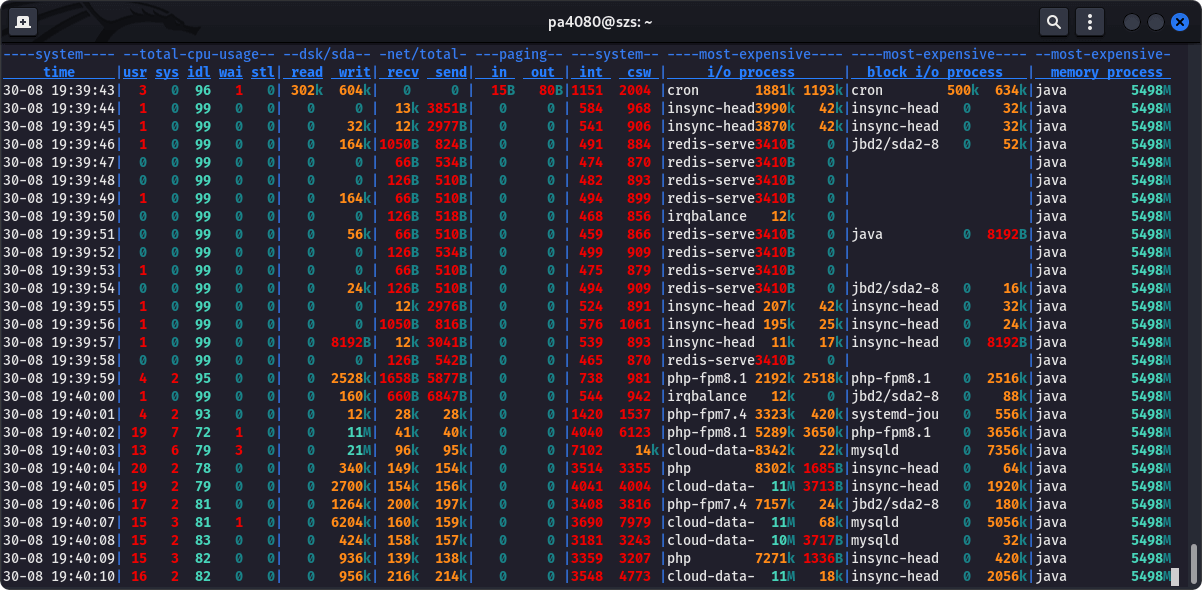
dstat command. 
Here is another example that will output the average I/O rate per minute.
dstat -tdD total 60
----system--------dsk/total--
     time      |  read  writ
¯¯¯¯¯¯¯¯¯¯¯¯¯¯¯¯¯¯¯¯¯¯¯¯¯¯¯¯¯
29-08 08:40:13 | 1138M 1782M
29-08 08:41:13 |  234k  744k
29-08 08:42:13 |  293k  171k
29-08 08:43:13 |  268k  113k
29-08 08:44:13 | 1100k  129k
And one example (source) with list of multiple drives.
dstat -tdD total,sda,sdb,sdc,md1 60
----system---- -dsk/total----dsk/sda-----dsk/sdb-----dsk/sdc-----dsk/md1--
     time     | read  writ: read  writ: read  writ: read  writ: read  writ
08-11 22:08:17|3549k  277k: 144k   28k: 851k   62k: 852k   60k:  25k   82k
08-11 22:09:17|  60k  258k:1775B   15k:  13k   63k:  15k   60k:  68B   74k
08-11 22:10:17| 176k  499k:   0    14k:  41k  122k:  41k  125k: 273B  157k
08-11 22:11:17|  42k  230k:   0    14k:9830B   54k:  14k   51k:   0    70k
08-11 22:11:52|  28k  132k:   0  5032B:5266B   33k:9479B   28k:   0    37k
The vmstat command
vmstat – virtual memory statistics – reports information about processes, memory, paging, block IO, traps, disks and cpu activity. The first report produced gives averages since the last reboot. Additional reports give information on a sampling period of length delay. The process and memory reports are instantaneous in either case.
Here is how to get statistics about the block devices – -d, in megabytes -Sm (1000000), or -SM (1048576) bytes.
sudo vmstat -d -Sm
disk-   ------------reads--------------- --------------writes--------------- ------IO-----
        total  merged   sec tors      ms    total  merged   sectors       ms    cur    sec
loop0      84       0      2554       81        0       0         0        0      0      0
loop1      84       0      2382       36        0       0         0        0      0      0
loop2      52       0       856       39        0       0         0        0      0      0
loop3      60       0       814       43        0       0         0        0      0      0
loop4      52       0       764       14        0       0         0        0      0      0
loop5     539       0     11200      240        0       0         0        0      0      0
loop6      87       0      2498      105        0       0         0        0      0      0
loop7     493       0     34854      228        0       0         0        0      0      1
sda   1284880  157343  65276608   752987  3936160 2077213 135566208  4487853      0   4123
sdc    437039  119521   4760810  2594193    96132  145500  54786232 10747453      0   3024
sdd   2614304  458294  24597746  6017154    63873 1360249  19094048  7394053      0   5798
sdb    136351    1445  34564266   329162    25383    2759  47585536  4447925      0    424
sr0       120       0      897        14        0       0         0        0      0      0
loop8      49       0      752        24        0       0         0        0      0      0
loop9      88       0     3334        42        0       0         0        0      0      0
loop10     11       0       28         0        0       0         0        0      0      0
The sar command
The sar command is part of the package sysstat. It outputs the contents of selected cumulative activity counters in the operating system. The activities are collected by the sysstat.service. After installing the package we need to enable the collector service and wait until some statistics are collected.
sudo apt install sysstat
sudo sed -i 's/ENABLED="false"/ENABLED="true"/' /etc/default/sysstat
sudo systemctl enable --now sysstat.service
systemctl cat sysstat-collect.timer
# /lib/systemd/system/sysstat-collect.timer
# /lib/systemd/system/sysstat-collect.timer
# (C) 2014 Tomasz Torcz <tomek@pipebreaker.pl>
#
# sysstat-12.5.2 systemd unit file:
#        Activates activity collector every 10 minutes

[Unit]
Description=Run system activity accounting tool every 10 minutes

[Timer]
OnCalendar=*:00/10

[Install]
WantedBy=sysstat.service
sar
Linux 5.15.39-4-pve (ubuntu-lxc-pve) 	08/28/22 	_x86_64_	(24 CPU)

20:41:48     LINUX RESTART	(24 CPU)

20:50:05        CPU     %user     %nice   %system   %iowait    %steal     %idle
21:00:00        all      1.66      0.00      0.26      0.02      0.00     98.06
21:10:10        all      2.66      0.00      0.27      0.03      0.00     97.03
21:20:13        all      1.92      0.00      0.29      0.02      0.00     97.76
Average:        all      2.09      0.00      0.27      0.03      0.00     97.62
Monitor the Files Size Changes Recursively
By the following command we can monitor which are the most written files for the past 10 minutes, larger than 800 Kb. This is done recursively for the directories /var/lib and /var/log. The output of the command is shown at Screen 4.
sudo watch -n 3 -d \
"find /var/lib /var/log -type f -size +800k -mmin -10 -printf '%-30s \t %t %p\n' | grep -Pv '\.(gz|[0-9])$'"
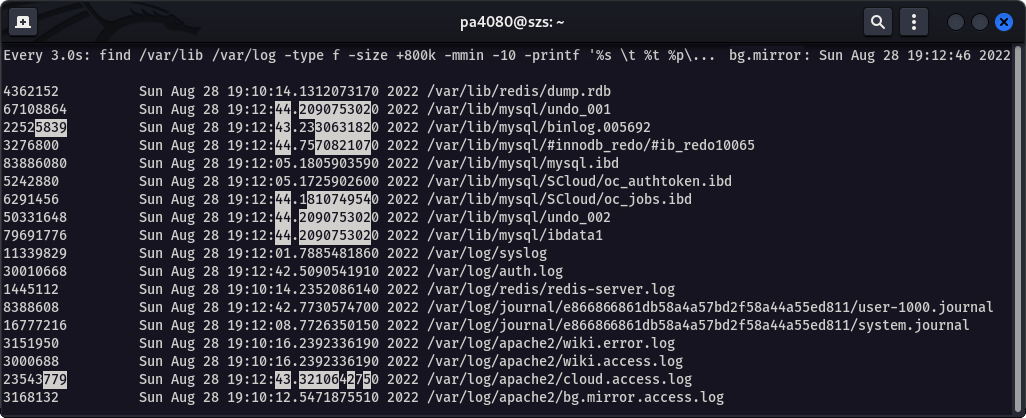
watch and find to monitor file change in real time. 
Here is an advanced version :) which outputs also an additional data generated by iostat:
sudo watch -n 3 -d \
"find /var/lib /var/log -type f -size +800k -mmin -10 -printf '%-30s \t %t %p\n' | grep -Pv '\.(gz|[0-9])$';
 echo;
 iostat /dev/sda2"
Every 3.0s: find /var/lib /var/log -type f -size +800k -mmin -10 -printf '%s \t %t %p\n'...; iostat /dev/sda2...

4362053          Mon Aug 29 08:25:15.1573410540 2022 /var/lib/redis/dump.rdb
67108864         Mon Aug 29 08:29:34.6284410810 2022 /var/lib/mysql/undo_001
3276800          Mon Aug 29 08:29:36.1604593970 2022 /var/lib/mysql/#innodb_redo/#ib_redo10127
83886080         Mon Aug 29 08:29:33.6604295080 2022 /var/lib/mysql/mysql.ibd
31459279         Mon Aug 29 08:29:34.2284362990 2022 /var/lib/mysql/binlog.005694
5242880          Mon Aug 29 08:29:33.6284291260 2022 /var/lib/mysql/SCloud/oc_authtoken.ibd
6291456          Mon Aug 29 08:29:34.6284410810 2022 /var/lib/mysql/SCloud/oc_jobs.ibd
50331648         Mon Aug 29 08:29:34.6284410810 2022 /var/lib/mysql/undo_002
79691776         Mon Aug 29 08:29:34.6284410810 2022 /var/lib/mysql/ibdata1
11873325         Mon Aug 29 08:29:01.5600457430 2022 /var/log/syslog
31441772         Mon Aug 29 08:29:08.0921238280 2022 /var/log/auth.log
1504046          Mon Aug 29 08:25:15.2373420090 2022 /var/log/redis/redis-server.log
8388608          Mon Aug 29 08:27:04.5226471030 2022 /var/log/journal/e8dsfe54457bd2f6a44344e1/user-1000.journal
33554432         Mon Aug 29 08:29:08.5241289930 2022 /var/log/journal/e8dsfe54457bd2f6a44344e1/system.journal
1183995          Mon Aug 29 08:25:17.2973666000 2022 /var/log/apache2/wiki.error.log
1170720          Mon Aug 29 08:25:17.3013666480 2022 /var/log/apache2/wiki.access.log
1166389          Mon Aug 29 08:25:14.0613279700 2022 /var/log/apache2/cloud.access.log
1243871          Mon Aug 29 08:25:13.9613267760 2022 /var/log/apache2/bg.mirror.access.log

Linux 5.15.0-46-generic (szs.space) 	08/29/22 	_x86_64_	(16 CPU)

avg-cpu:  %user   %nice %system %iowait  %steal   %idle
           2.50    0.00    0.73    1.06    0.00   95.71

Device             tps    kB_read/s    kB_wrtn/s    kB_dscd/s    kB_read    kB_wrtn    kB_dscd
sda2             55.71       454.89       741.44       421.11   32361849   52747168   29958424
From the file system /proc/diskstats and /sys/block/<dev>/stat
The main pros of this approach (proposed here) is that, you do not need any special tool. Information about these files and the columns inside them could be obtained at:
- Kernel.org: Block layer statistics in
/sys/block/<dev>/stat - Kernel.org: I/O statistics fields
- Torvalds GitHub: Linux > Docs > admin-guide > iostats.rst
- Torvalds GitHub: Linux > Documentation > ABI > testing > procfs-diskstats
cat /sys/block/sda/stat && cat /sys/block/sda/sda2/stat
              88794 40932 3793872 122954 51212 37863 1655608 55654 0   80500 191053 0   0   0   0   17864 12444
              88553 40932 3786488 122874 51212 37863 1655608 55654 0   80452 178529 0   0   0   0   0     0
# -   -  -    1     2     3       4      5     6     7       8     9   10    11     12  13  14  15  16    17
# 1   2  3    4     5     6       4      8     9    10       11    12  13    14     15  16  17  18  19    20
cat /proc/diskstats | grep -Pw 'sda[2]?'
  8   0  sda  88794 40932 3793872 122954 51212 37863 1655608 55654 0   80500 191053 0   0   0   0   17864 12444
  8   2  sda2 88553 40932 3786488 122874 51212 37863 1655608 55654 0   80452 178529 0   0   0   0   0     0
# 1   2  3    4     5     6       4      8     9    10       11    12  13    14     15  16  17  18  19    20
curl https://raw.githubusercontent.com/torvalds/linux/master/Documentation/ABI/testing/procfs-diskstats
What:		/proc/diskstats
Date:		February 2008
Contact:	Jerome Marchand <jmarchan@redhat.com>
Description:
		The /proc/diskstats file displays the I/O statistics
		of block devices. Each line contains the following 14
		fields:

		==  ===================================
		 1  major number
		 2  minor mumber
		 3  device name
		 4  reads completed successfully
		 5  reads merged
		 6  sectors read
		 7  time spent reading (ms)
		 8  writes completed
		 9  writes merged
		10  sectors written
		11  time spent writing (ms)
		12  I/Os currently in progress
		13  time spent doing I/Os (ms)
		14  weighted time spent doing I/Os (ms)
		==  ===================================

		Kernel 4.18+ appends four more fields for discard
		tracking putting the total at 18:

		==  ===================================
		15  discards completed successfully
		16  discards merged
		17  sectors discarded
		18  time spent discarding
		==  ===================================

		Kernel 5.5+ appends two more fields for flush requests:

		==  =====================================
		19  flush requests completed successfully
		20  time spent flushing
		==  =====================================

		For more details refer to Documentation/admin-guide/iostats.rst
Miscellaneous
Benchmark Tools
iozone– filesystem benchmark – it is a filesystem benchmark tool. The benchmark generates and measures a variety of file operations.iozonehas been ported to many machines and runs under many operating systems. This document will cover the many different types of operations that are tested as well as coverage of all of the command line options. Manual with examples: kongll.github.io/iozonehdparm– get/set SATA/IDE device parameters – provides a command line interface to various kernel interfaces supported by the Linux SATA/PATA/SAS "libata" subsystem and the older IDE driver subsystem. Perform read test:
sudo hdparm -tT /dev/nvme0n1
dd– convert and copy a file – perform write and read tests (really simplified just as a note):
dd if=/dev/zero of=./test.file bs=4096k count=4096
dd if=./test.file of=/dev/zero bs=4096k count=4096
Monitoring Tools
htop [-dCFhpustvH]– interactive process viewer – It is similar totop, but allows you to scroll vertically and horizontally, and interact using a pointing device (mouse). You can observe all processes running on the system, along with their command line arguments, as well as view them in a tree format, select multiple processes and acting on them all at once. Tasks related to processes (killing, renicing) can be done without entering their PIDs.top [-hv|-bcEeHiOSs1 ‑d secs ‑n max ‑u|U user ‑p pids ‑o field ‑w [cols]]– display Linux processes – it provides a dynamic real-time view of a running system. It can display system summary information as well as a list of processes or threads currently being managed by the Linux kernel. The types of system summary information shown and the types, order and size of information displayed for processes are all user configurable and that configuration can be made persistent across restarts.atop– Advanced System & Process Monitor – The programatopis an interactive monitor to view the load on a Linux system. It shows the occupation of the most critical hardware resources (from a performance point of view) on system level, i.e. cpu, memory, disk and network. It also shows which processes are responsible for the indicated load with respect to cpu and memory load on process level. Disk load is shown per process if "storage accounting is active in the kernel. Network load is shown per process if the kernel modulenetatophas been installed.
References
- Htop: GitHub | Home page [
htop] - Unix and Linux: How can I monitor disk I/O? [
sar,iostat,iotop] - Unix and Linux: How do I measure total disk I/O per hour? [
dstat,iostat] - Proxmox Forum: Disk prevent from spinning down because of pvestatd [
dstat] - TechMint:
Iotop– Monitor Linux Disk I/O Activity and Usage Per-Process Basis - PVE HDD Sleep (Suspend)
- Preload Tool for Better System Performance
- Linux Swap and Swapfile