Linux I/O Monitoring and Analyze
There is a couple of tools available that allows you to monitor and analyze the disk I/O performance of your Linux driven system. Here are listed few of them and also how to install and examples of their basic usage.
Htop 3.2+
If the latest version of htop is available at your distribution, there is available an additional tab that shows the I/O metrics of the instance – Screen 1. Here is how to check the available version and install htop.
sudo apt show htop 2>/dev/null | grep '^Version'
sudo apt install htop
Install the latest version of htop 3.2.1–1 on Ubuntu Server 22.04.1 from a .deb package.
cd /tmp
wget --no-check-certificate https://http.us.debian.org/debian/pool/main/h/htop/htop_3.2.1-1_amd64.deb
sudo apt install ./htop_3.2.1-1_amd64.deb
To be able to see all data in most cases you need to run the tool as root:
sudo htop
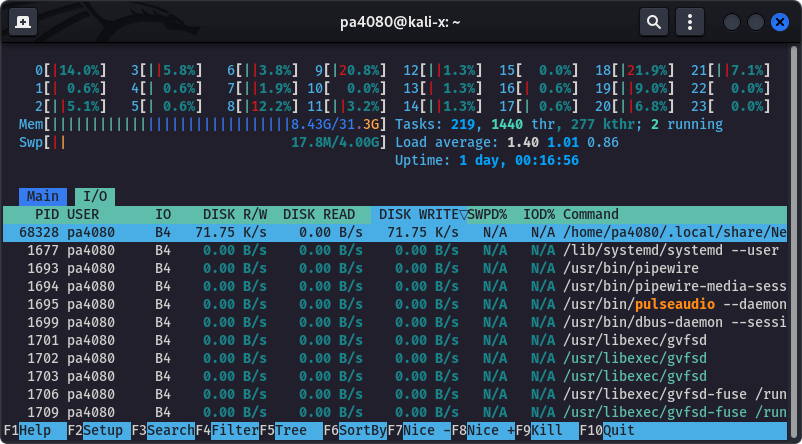
htop (v 3.2+). Use Tab to switch to the I/O tab, then use F6 to open the Sort by menu, and sort by IO_WRITE_RATE. The screenshot is taken on Kali Linux 2022. 
Monitor the Files Changes Recursively
By the following command we can monitor which are the most written files for the past 10 minutes, larger than 800 Kb. This is done recursively for the directories /var/lib and /var/log. The output of the command is shown at Screen 2.
sudo watch -n 3 -d \
"find /var/lib /var/log /var/spool -type f -size +800k -mmin -10 -printf '%s    \t %t %p\n' | grep -Pv '\.(gz|[0-9])$'"
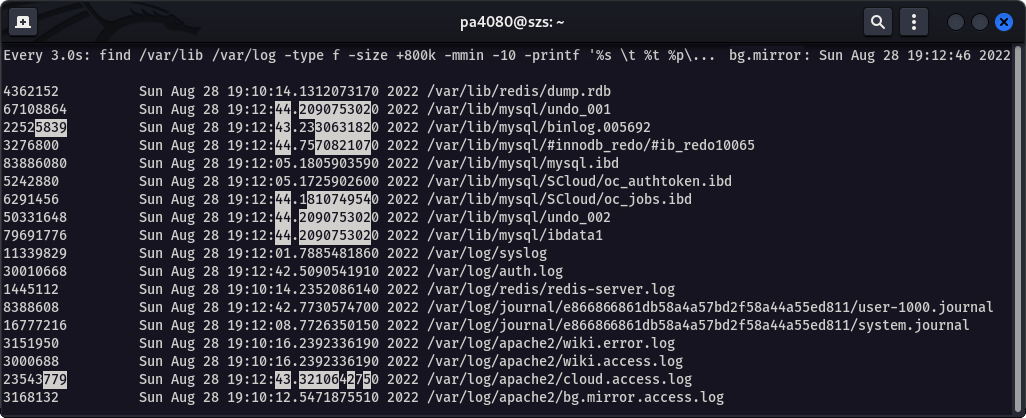
watch and find to monitor file change in real time. 
References